
The outbreak of COVID-19 has highlighted the importance of location, something which many businesses were already aware of but not quite addressing. The value of “where” is of utmost importance in understanding buyer behaviour, especially in the context of device mobility. Whilst many companies might exploit the core capability of an Excel add in for data analysis, there has been much less use of maps in Excel.
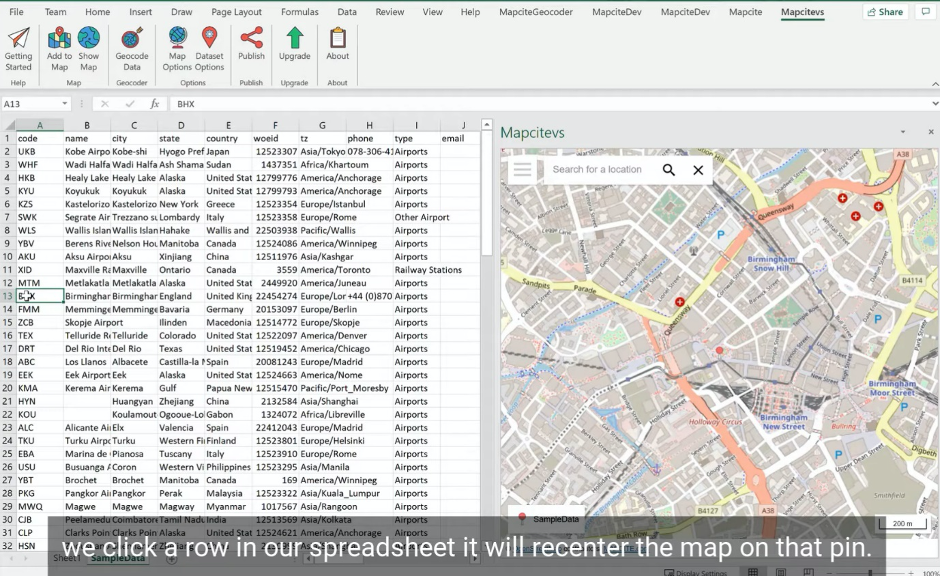
Geospatial data analytics has traditionally been addressed by domain experts often referred to as data scientists. However, the ability to put geospatial analytics in the hands of everyday business users who are making decisions “on the fly” would seem to be nirvana. Those users often use standard desktop applications such as Excel. The nirvana point is the immediate insight Mapcite’s geospatial data visualisations can provide that isn’t readily apparent from any other Excel add on for data analysis. Take the example images below which has used the Mapcite Excel map add-in which can be downloaded free from the Microsoft App Store.
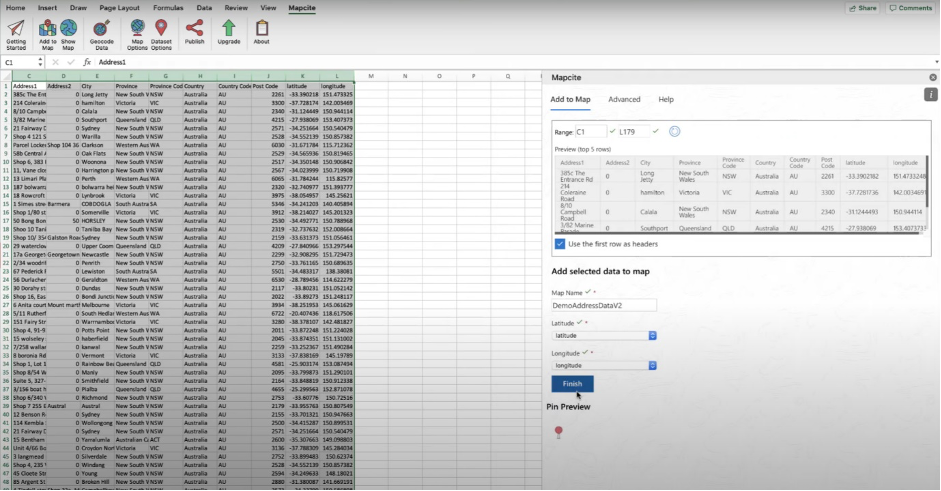
The first image shows the ability to take a list of stores and addresses in Excel and add them into a map just by clicking Add to Map.
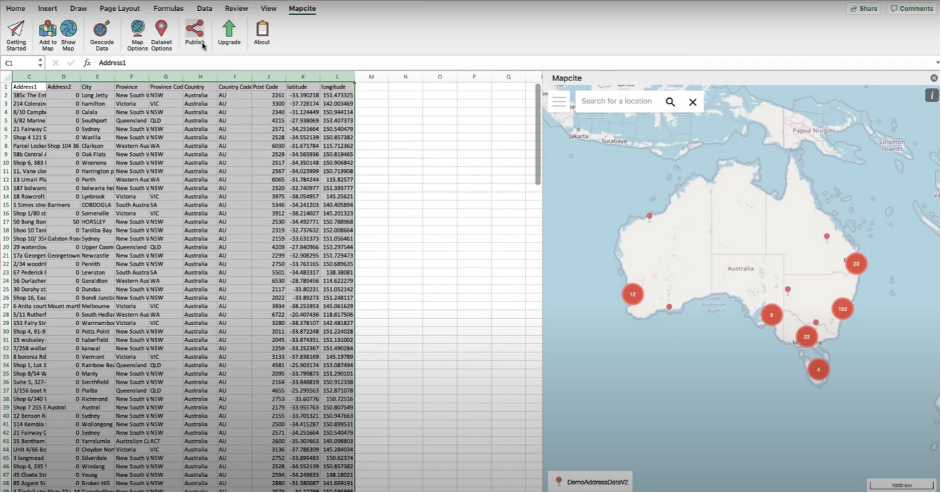
The second image below shows the resultant map at the Australia-wide level. From this point you can begin using your Excel add in for data analysis by drilling down into the map or by using the tools available within the Mapcite map, all while remaining within Excel!
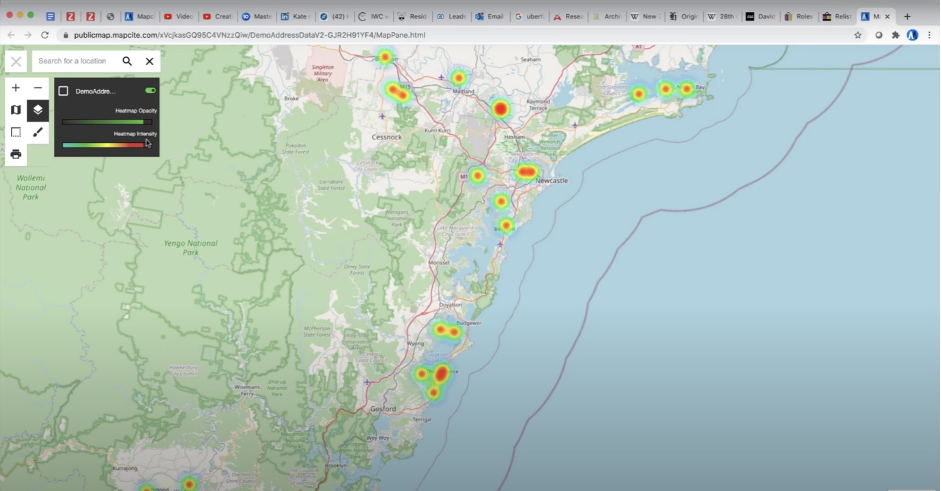
Finally, the image below shows the result of clicking the “Publish” button which produces a URL which is accessible by anyone to whom you send the link. They can then access a fully interactive map with all the Mapcite tools available, in this case the heat map capability for a specific region in NSW.
This is the new world of insight from an Excel add on for data analysis, with a focus on “where”. If this isn’t the best Excel addin, I would be very surprised.