
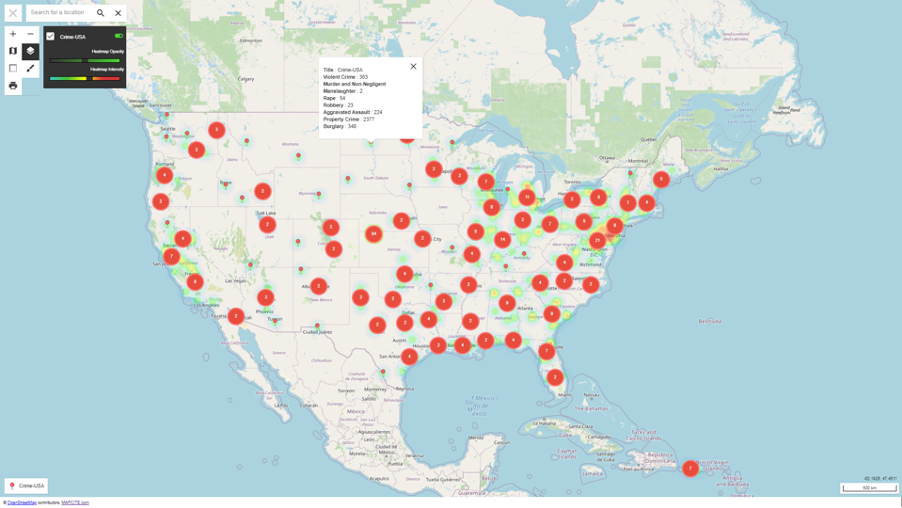
This interactive map presents an overview of violent crime in the US in 2018 by cities/regions. It is not until you click down to individual location pins and see the table of statistics, that the full picture begins to appear as exampled in the above image. The number, type, and extent of crime across the US is frightening when compared to countries such as Australia, Japan, and many others.
The source data comes from the US Criminal Justice Information Services Division.
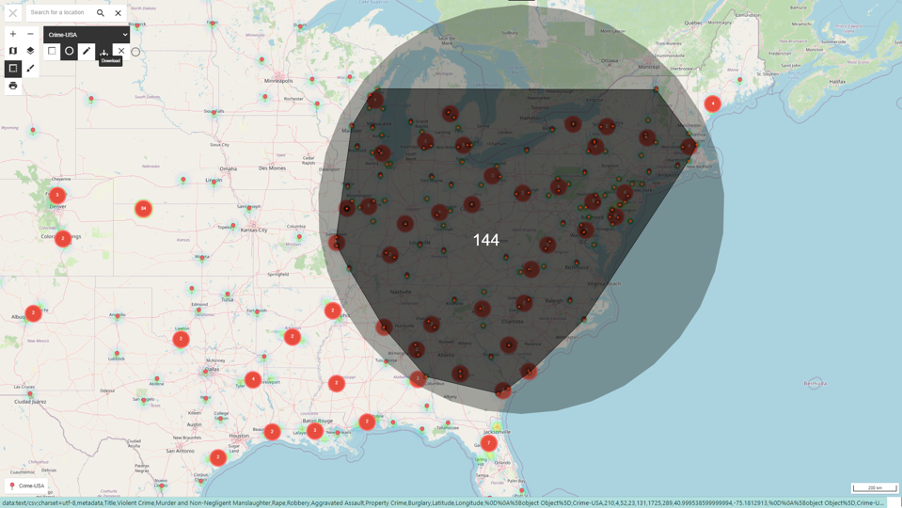
By circling the area as shown in the image below, we can with just one click automatically download that data into Excel which then shows 180,479 violent crime incidents within these 144 aggregated locations representing:
- Murder and Non-Negligent Manslaughter
- Rape
- Robbery, and
- Aggravated Assault
In addition, the downloaded table shows that there are a further 1,157,752 incidents of Property Crime and Burglary in this circled region alone.

With access to this interactive map you can similarly download data from various regions and run your own comparisons and analysis in Excel. The Mapcite Excel add-in is free, including this innovative ability to publish your interactive maps to others, and can be downloaded from the Microsoft App Store.
Further information on the Publisher capability as well as other interactive maps can be found on the Mapcite website.