
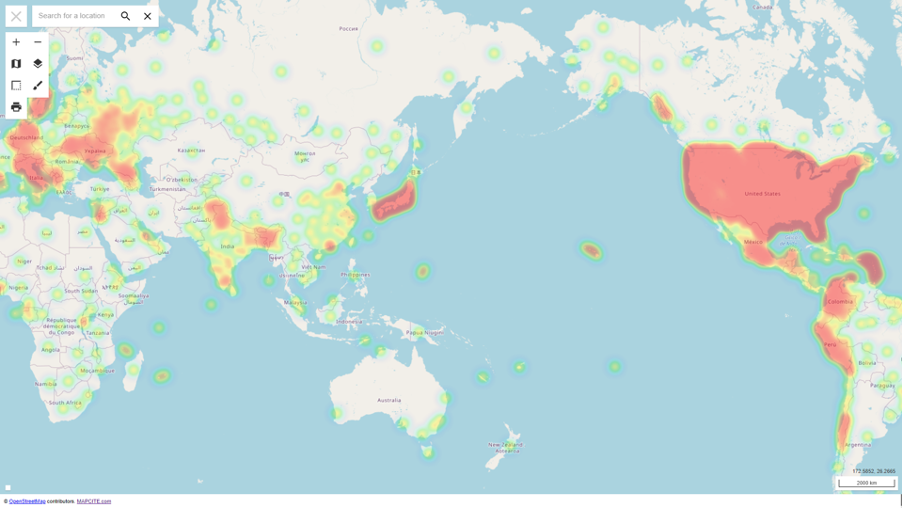
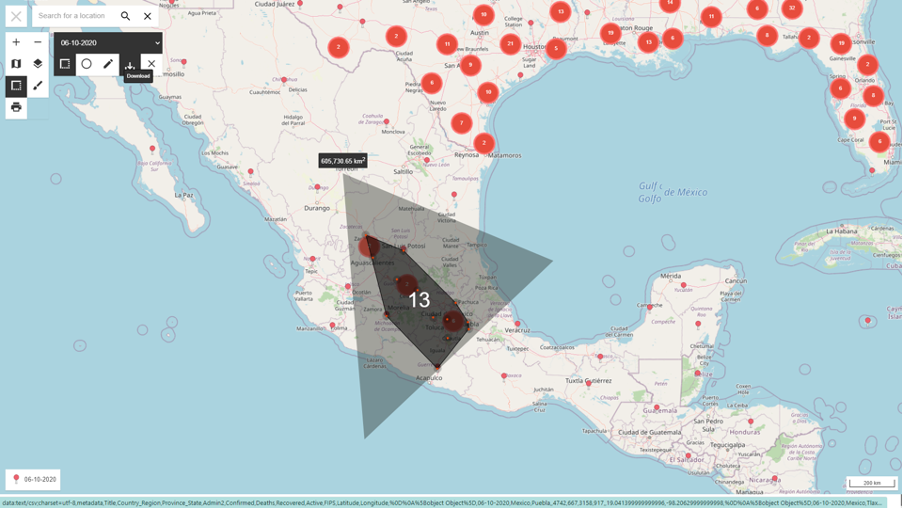
The above heat map shows the known global presence of COVID-19 s at 12 June 2020. The underlying data contains confirmed cases, deaths, recovered, and still active, on a city/regional basis. For any region of interest, you can choose the Draw icon in the drop-down tools list, then select Polygon to draw around your desired area. All the data within that area can then be downloaded straight to Excel as per the below image.
These interactive “Publisher” maps are a recent feature of the Mapcite Excel add-in available from the Microsoft App store. Once a map has been created by an Excel user they can simply hit “Publish” to produce a globally accessible URL. Tools are then available within the published interactive map to examine this data by various means including heatmaps and location pins, for any global or local region. Any location can be merely entered into the search bar and the map will immediately go to that location.
Further information on the Mapcite Excel Publisher feature and other data examples can be found on our Mapcite Excel Publish product page.